Disease Similarity Networks based on gene expression profiles

Red edges denote posite interactions

Blue edges denote negative interactions

Dashed red lines denote positive interactions that correspond to known comorbidities (See Documentation)

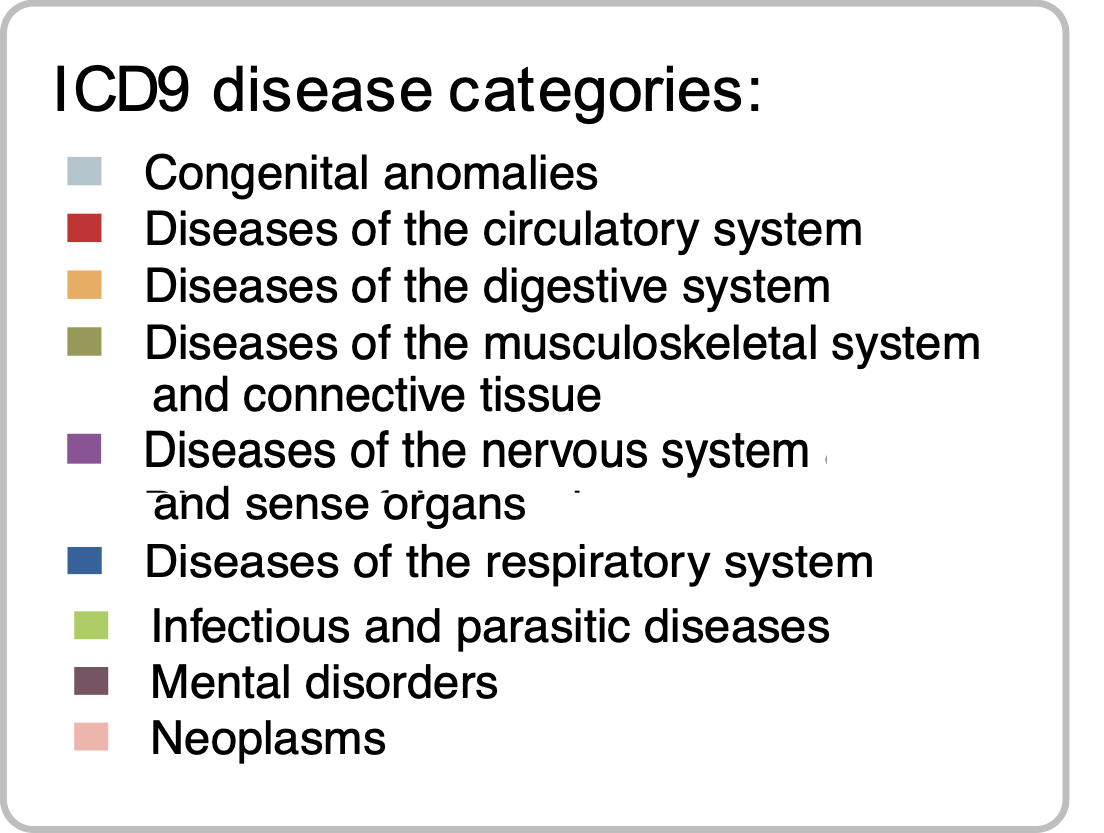
Nodes are coloured according to their ICD9 disease category


Reactome pathways significantly dysregulated in human diseases

The heatmap shows the dysregulated Reactome pathways (rows) in the diseases (columns)

Overexpressed pathways

and

Underexpressed pathways


For each disease, Reactome pathways significantly up- and down-regulated were identified using the GSEA method (FDR <= 0.05)

Ward2 algorithm was applied to cluster diseases based on the Euclidean distance of their binarized Normalized Effect Size (1s, and -1s for up- and down-regulated pathways)


Over and Underexpressed pathways shared by

epidemiological interactions (EIs) and non-epidemiological interactions (NEIs)

Each point represents a Reactome pathway category

The size of the points corresponds to the mean number of shared pathways in the EIs

The color corresponds to the ratio of the mean number of shared pathways in EIs versus NEIs

(e.g. red indicates that EIs share more altered pathways than NEIs)


Genes and Pathways altered in diseases

or shared by disease groups and pairs


Patient stratification reveals the molecular basis of disease comorbidities

Beatriz Urda-García, Jon Sánchez-Valle, Rosalba Lepore and Alfonso Valencia


Tutorial

Download the tutorial of the web application (
tutorial
)


Disease Similarity Network (DSN)

First, we implemented an RNA-seq pipeline to perform Differential Expression Analysis for each disease. Next, we computed the spearmans' correlation between the diseases' gene expression profiles. We kept significant interactions after multiple testing correction (FDR < 0.05).
The obtained DSN contains positive and negative interactions, representing diseases with significantly similar and dissimilar gene expression profiles, respectively. Next, we evaluated the overlap of the positive interactions in the DSN with the epidemiological network from Hidalgo et al. Positive interactions in the DSN described in this epidemiological network are represented with red dashed lines.

Stratified Similarity Network (SSN)

We stratified each disease into subgroups of patients with similar expression profiles (meta-patients) by applying the k-medoids clustering algorithm to its normalized and batch effect corrected gene expression matrix. Next, we performed Differential Expression Analyses for each meta-patient.
To analyze the disease subtype-associated comorbidities, we built the Stratified Similarity Network (SSN) connecting meta-patients and diseases based on the similarities of their gene expression profiles (following the same methodology described for the DSN). The resulting Stratified Similarity Network (SSN) contains three types of interactions: (1) the previously described disease-disease interactions, (2) interactions connecting different meta-patients and (3) interactions connecting meta-patients to diseases.

Network visualization

The user can select the network (DSN or SSN) and interactions of interest (all, positive or negative interactions). A threshold for the edge's weight (the absolute value of the Spearman's correlation) can also be applied. By default, nodes are colored based on their International Code of Diseases 9 (ICD9) category. Moreover, community detection algorithms (greedy modularity optimization and random walks) can be computed. The DSN and SSN backbones can be extracted based on the metric or ultra-metric closure, following Simas et al method.
Nodes can also be highlighted within the network and the interactions entailing specific nodes (diseases and or meta-patients), genes and pathways can be selected. Genes are represented with ensemble ids and REACTOME, KEGG and GO pathways are available. When selecting genes and pathways, positive interactions that share the alteration of such genes or pathways in the same / opposite direction will be shown for positive / negative interactions respectively. The user can also select only the interactions that are commonly up or downregulated for positive interactions or up-down and down-up for negative interactions. In the later cases, the table will clarify which diseases have the gene or pathways up vs down (Disease 1 - Disease 2).

Molecular mechanism behind diseases

It shows the Reactome pathways significantly dysregulated in human diseases by pathway category. For each disease, Reactome pathways significantly over and underexpressed were identified using the GSEA method (FDR <= 0.05). Ward2 algorithm was applied to cluster diseases based on the Euclidean distance of their binarized Normalized Effect Size (1s, and -1s for over and underxpressed pathways). The heatmap shows the dysregulated Reactome pathways (rows) in the diseases (columns), where over and underexpressed pathways are blue and red colored respectively.

Molecular mechanism behind disease interactions

Over and underexpressed pathways behind epidemiological and not epidemiological interactions for each disease category pair. Percentage of epidemiological versus non epidemiological interactions that share overexpressed or underexpressed pathways. Each point represents a Reactome pathway category. The size of the points corresponds to the mean number of shared pathways in the epidemiological interactions. The color corresponds to the ratio of the mean number of shared pathways in epidemiological versus non epidemiological interactions.

Get genes and pathways

In this section you can access the differentially expressed genes and pathways in a given phenotype (disease or meta-patient) and commonly dysregulated in phenotype pairs or groups.
  • If you select one phenotype, you will get the table of dysregulated genes and pathways for that phenotype. You can filter the tables by selecting only the features that are significantly altered or by selecting only the over or underexpressed features.
  • If you only select two or more phenotypes, you will get the genes or pathways that are significantly altered in all those phenotypes. Again, you can select only the over or the underexpressed features.